
The first time an incident spanned several pods, I found myself running kubectl logs in four terminal tabs, scrolling each one, and trying to line up timestamps in my head. Pods restart, get rescheduled, and disappear — and when a pod is gone, so are its logs. By the time I'd pieced the story together, the evidence had already been garbage-collected.
This is the problem centralized logging solves: ship every container's logs off the node into one searchable place before the pod vanishes. The classic answer is the ELK stack, but Elasticsearch indexes the full text of every line, which means a lot of RAM and disk — a heavy tenant on a cluster you'd rather spend on your actual workloads.
This post walks through a lighter, Kubernetes-native alternative: Fluent Bit + Loki + Grafana. By the end you'll understand the role each plays in a cluster, why a DaemonSet is the right shape for the collector, how Kubernetes metadata gets attached to your logs, and the one labeling mistake that quietly destroys a Loki setup — a mistake K8s makes especially easy to commit.
The mental model
Three components, three jobs:
- Fluent Bit is the collector. In Kubernetes it runs as a DaemonSet, so the scheduler places exactly one Fluent Bit pod on every node. That pod tails the log files of all containers running on its node, enriches them with Kubernetes metadata, and forwards them to Loki. It's written in C, so each agent costs single-digit megabytes of memory.
- Loki is the store. It's Grafana Labs' log database, and its defining trick is that it does not index log contents. It indexes only a small set of labels (like
namespace="prod"orapp="checkout") and keeps the raw log text compressed in object storage. Less indexing means far less CPU, RAM, and disk than Elasticsearch. - Grafana is the window. You almost certainly already run it for cluster metrics. Add Loki as a data source and your logs sit right next to your dashboards, queried with a language called LogQL.
The flow looks like this:
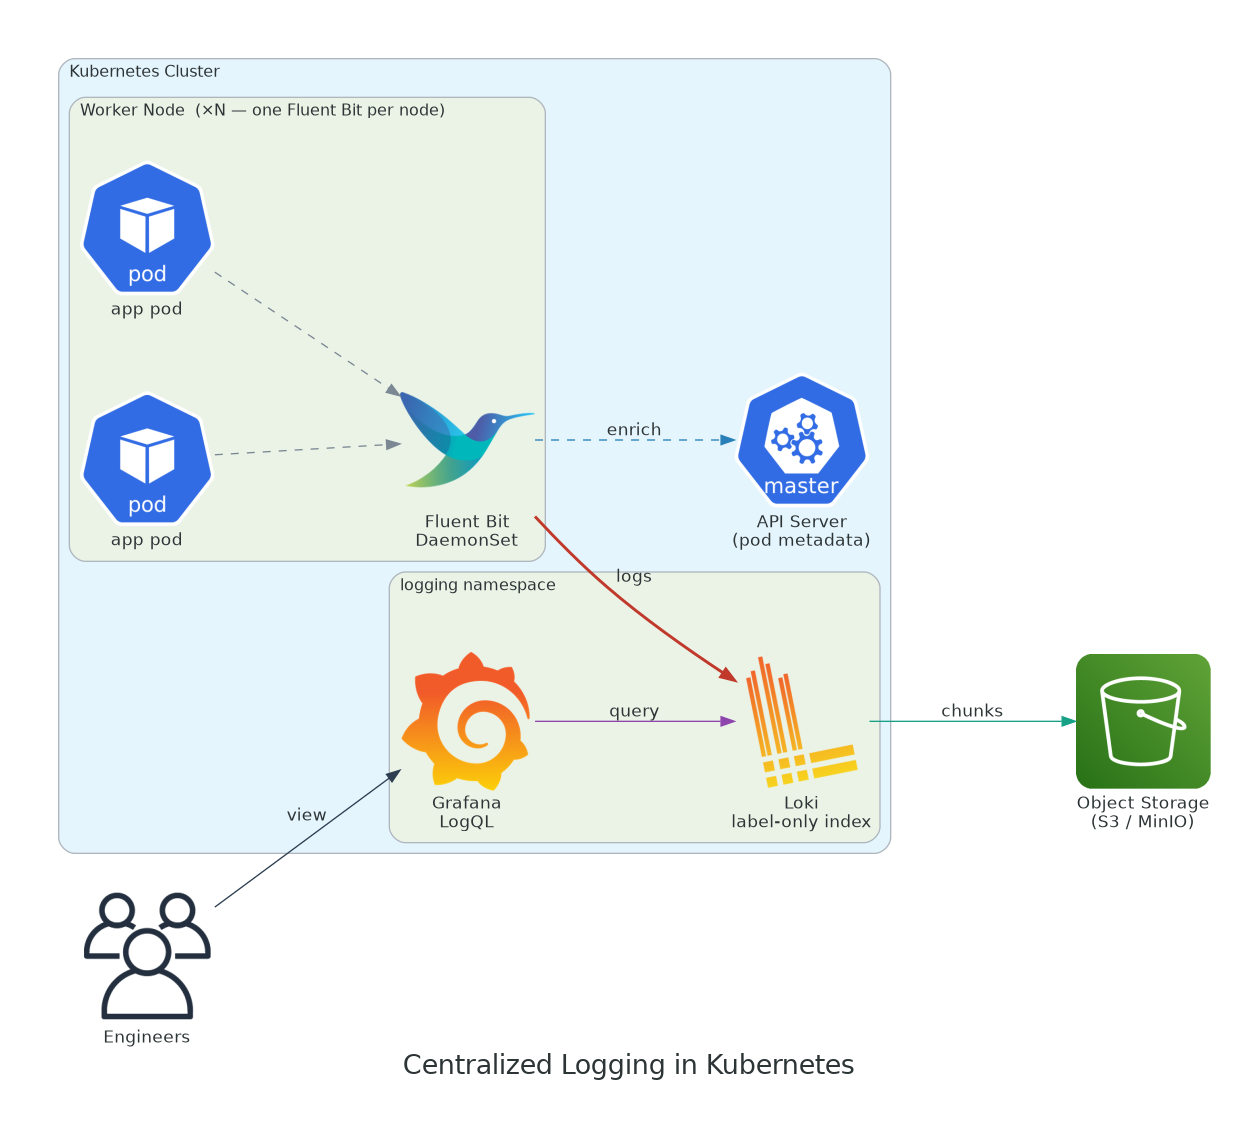
Reading it left to right: each worker node runs one Fluent Bit pod that scrapes the container logs of every pod on that node. Fluent Bit calls the API server to enrich each line with pod metadata, then pushes the logs to Loki. Loki keeps only a small label index in memory and writes the bulk log data as compressed chunks to object storage (S3 or MinIO). When an engineer investigates, they query Grafana, which reads back from Loki in LogQL. That separation — light index, cheap bulk storage — is the whole reason this stack stays affordable.
(The diagram was generated with the diagrams Python library — diagram-as-code, so it lives in your repo and re-renders from a script rather than a drawing tool.)
Why a DaemonSet, and where the logs actually live
This part trips people up, so it's worth being concrete. When a container writes to stdout/stderr, the container runtime on the node captures it and writes it to a file under /var/log/pods/..., with convenient symlinks in /var/log/containers/. Those files live on the node, not inside your app pod.
That's why the collector is a DaemonSet: by running one agent per node and mounting the node's /var/log directory into it, a single Fluent Bit pod can read the logs of every container on that node without your applications needing to do anything at all. No sidecars, no logging libraries, no code changes.
Enriching with Kubernetes metadata
A raw log line off the node filesystem is just text plus a filename. The filename encodes the pod, namespace, and container, but that's awkward to query. Fluent Bit's kubernetes filter fixes this: it parses that filename and calls the Kubernetes API to attach structured metadata — namespace, pod name, container name, and the pod's labels — to every record. This is the feature that makes the whole stack feel native: you end up able to slice your logs by the same namespaces and app labels you already use everywhere else.
Here's a Fluent Bit config (the 3.x YAML format) that tails container logs, runs the kubernetes filter, and ships to Loki. This would live in a ConfigMap mounted into the DaemonSet:
service:
  flush: 1
  log_level: info

pipeline:
  inputs:
    - name: tail
      path: /var/log/containers/*.log
      tag: kube.*
      multiline.parser: docker, cri   # stitch split lines back together

  filters:
    - name: kubernetes
      match: kube.*
      merge_log: on                   # parse JSON app logs into fields
      keep_log: off

  outputs:
    - name: loki
      match: "*"
      host: loki-gateway.logging.svc
      port: 3100
      # index ONLY these stable, low-cardinality dimensions:
      labels: job=fluentbit
      label_keys: $kubernetes['namespace_name'], $kubernetes['labels']['app']
Note multiline.parser on the input — it reassembles stack traces that the runtime split across many physical lines, which is the difference between a readable error and twenty disconnected fragments during an incident.
Installing the pieces
In a real cluster you don't hand-write Deployments for this; you use Helm. The common path is to install Loki and Grafana from the Grafana Labs charts and Fluent Bit from its own chart:
helm repo add grafana https://grafana.github.io/helm-charts
helm repo add fluent https://fluent.github.io/helm-charts

# Loki (single-binary mode is plenty to start)
helm install loki grafana/loki -n logging --create-namespace \
  --set deploymentMode=SingleBinary

# Grafana
helm install grafana grafana/grafana -n logging

# Fluent Bit as a DaemonSet, pointed at Loki
helm install fluent-bit fluent/fluent-bit -n logging
Then in Grafana, add a Loki data source pointing at the in-cluster service (something like http://loki-gateway.logging.svc:3100), open Explore, and run your first LogQL query:
{namespace="prod"}
That curly-brace expression selects every stream labeled namespace="prod". You filter from there — {namespace="prod"} |= "error" scans those streams for the word error at query time, and {app="checkout"} | json | level="error" parses JSON logs and filters on a field. The labels narrow down which streams to read; the pipe expressions search within them.
The mistake that wrecks Loki: label cardinality (and K8s makes it tempting)
If you remember one thing from this post, make it this.
Every unique combination of label values creates a separate stream, and Loki tracks each stream in its index. Low-variety labels like namespace, app, and container are perfect — a cluster has a bounded, small number of those. But Kubernetes is full of high-variety values that look like tempting labels and aren't:
podname — every pod carries a random hash suffix, so a new ReplicaSet rollout spawns a fresh set of label values. Usepodas a label and your stream count climbs with every deploy.pod_id/ UID, container IDs, node IPs- anything per-request:
request_id,trace_id,user_id
Promote any of those to a Loki label and the index balloons, ingestion slows, and queries time out. This is the number-one reason people wrongly conclude "Loki doesn't scale" — the labels were fighting the design. Notice that the config above deliberately uses only namespace_name and the app label, and leaves the pod name out of the label set.
The rule: labels are for the few stable dimensions you filter on; everything else stays in the log line. You can still find a specific pod or request_id — do it as a filter (|= "checkout-7d9f8-abc12"), which is exactly the brute-force scan Loki is built for.
A couple more things worth knowing
Retention and storage. By default Loki keeps logs indefinitely. Set a retention period in the chart values, and back Loki with object storage (S3, GCS, or in-cluster MinIO) rather than a PersistentVolume, so log volume scales independently of your nodes.
Dropping noise. Cluster components and health checks produce enormous, low-value log volume. A Fluent Bit grep or nest filter to exclude noisy namespaces (or drop kube-system chatter) keeps both cost and query clutter down.
Wrapping up
You now have the shape of a Kubernetes logging stack that costs a fraction of ELK: a Fluent Bit DaemonSet collects from every node and tags each line with real Kubernetes metadata, Loki stores it with cheap label-only indexing, and Grafana queries it in LogQL beside your existing dashboards. No sidecars, no app changes, and it runs comfortably on a modest cluster.
The mental shift that makes it click is accepting Loki's bargain — index labels, not text — and respecting it by keeping label cardinality low, which in Kubernetes specifically means resisting the urge to label by pod name. Do that, and the next time an incident spans five pods, you'll have one search box instead of five kubectl logs tabs racing the garbage collector.
Further reading: the Loki docs on labels and storage, and the Fluent Bit Kubernetes docs on the DaemonSet and the kubernetes filter.